TASK 1
You should spend about 20 minutes on this task.
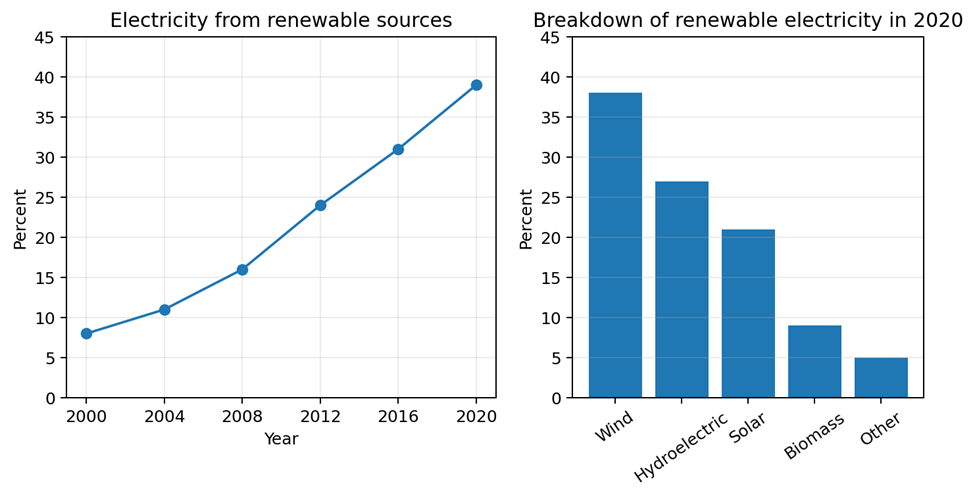
The line graph below shows the proportion of electricity generated from renewable sources in a country between 2000 and 2020. The bar chart shows the breakdown of renewable electricity production by source in 2020.
Summarise the information by selecting and reporting the main features, and make comparisons where relevant.
Write at least 150 words.
TASK 2
You should spend about 40 minutes on this task.
Write about the following topic:
Some people think that university students should only study subjects related to their future careers, while others believe they should be free to study a wider range of subjects. Discuss both views and give your own opinion.
Give reasons for your answer and include any relevant examples from your own knowledge or experience.
Write at least 250 words.